Support Center.
Get Started or Become a Pro. Browse our support articles to learn how to get the best out of PeopleGoal.
Numerical Elements
Numerical elements work with number values to capture numerical data and calculated outputs from your app participants. These can be applied to many different areas of your HR workflow like salary data, compensation calculations, progress sliders and more.
There are six numerical elements to work with:
Number
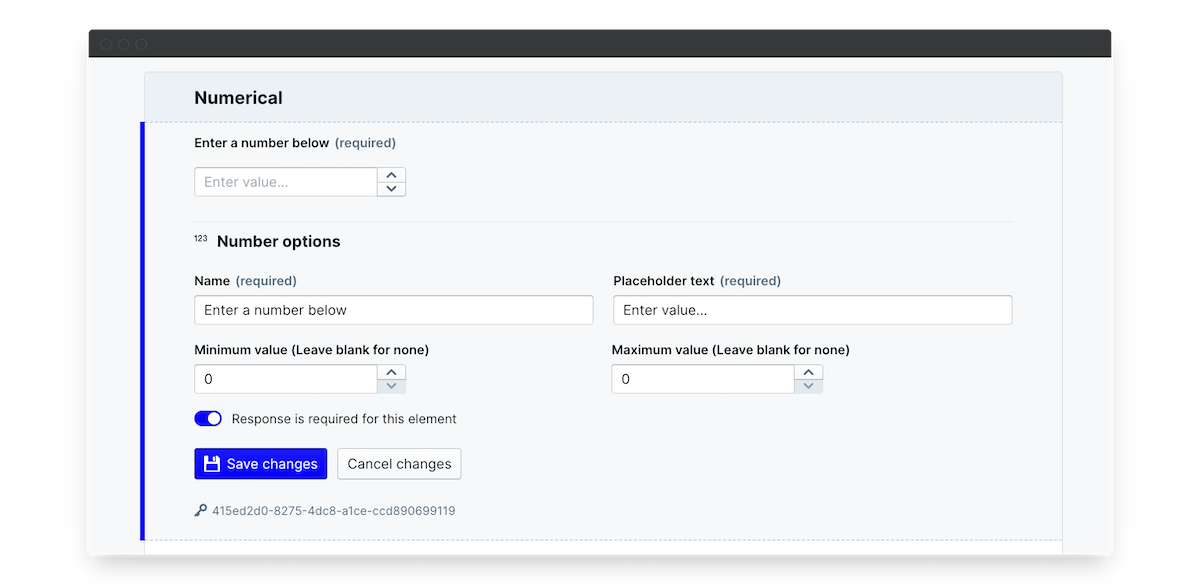
The Number element is a basic number input for participants to enter a value. These can be whole numbers or decimals, and you can set the minimum and maximum value in your Number element editor (leave these blank for no min/max). When providing their number response, users can type in a number or use the up/down arrows to increase/decrease their input.
Currency
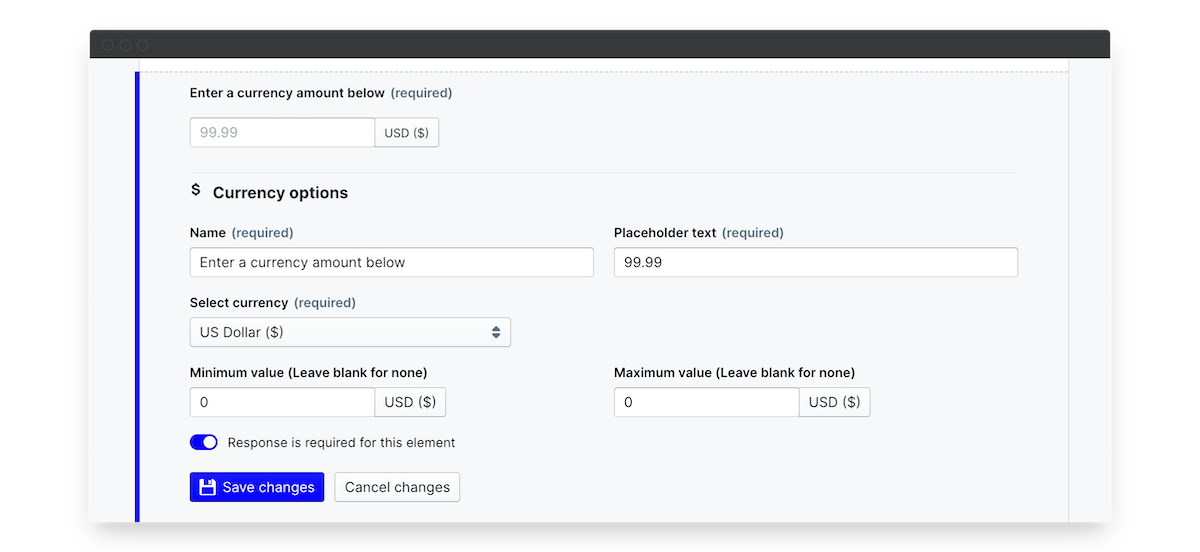
The Currency element works the same as the Number element, with the currency indicator automatically added to the numerical value. Click the Select currency field in your element editor to choose your local currency.
Training Course Costs
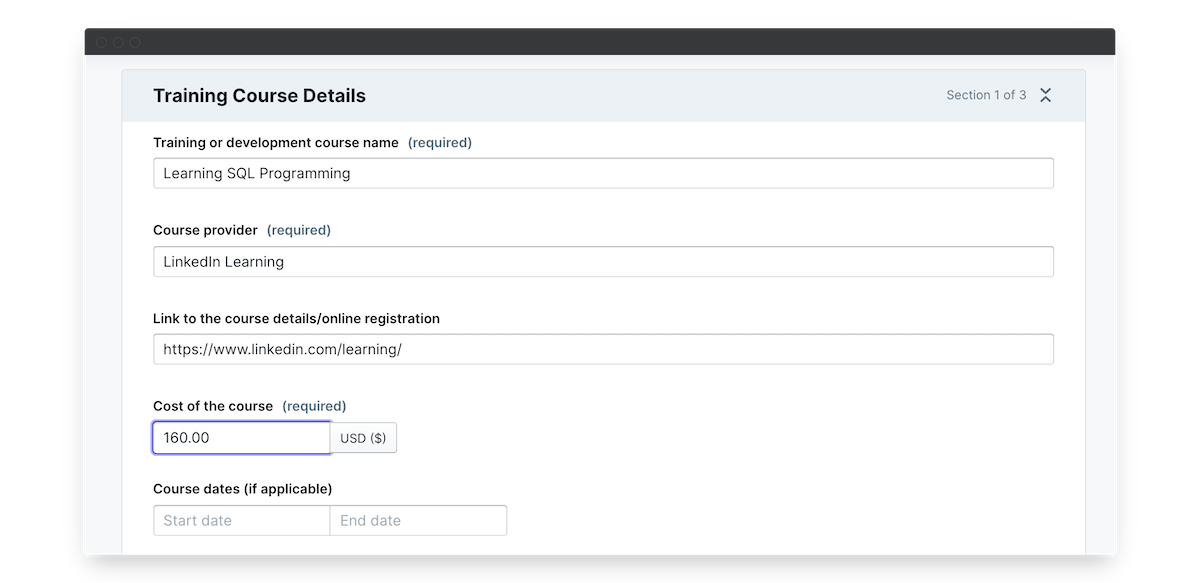
When applying for external training courses under a department's budget, employees can use our Training Approval app to request approval for course registration. In the Training Course details, a currency element is included so that the Approver can assess whether the course is within the budget and appropriate for this course type.
Salary Input
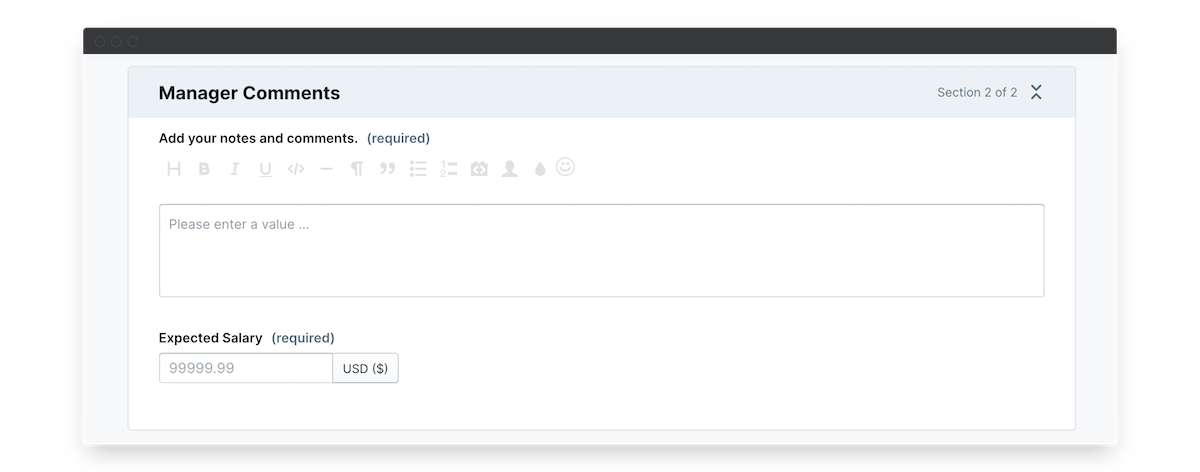
In a new hire application form or a compensation benchmarking process, include a currency field for the employee's expected salary. You can then report on the range of salaries added by applicants, use these for benchmarking in your compensation workflow, or compare expected salaries to the departmental budget.
Percentage
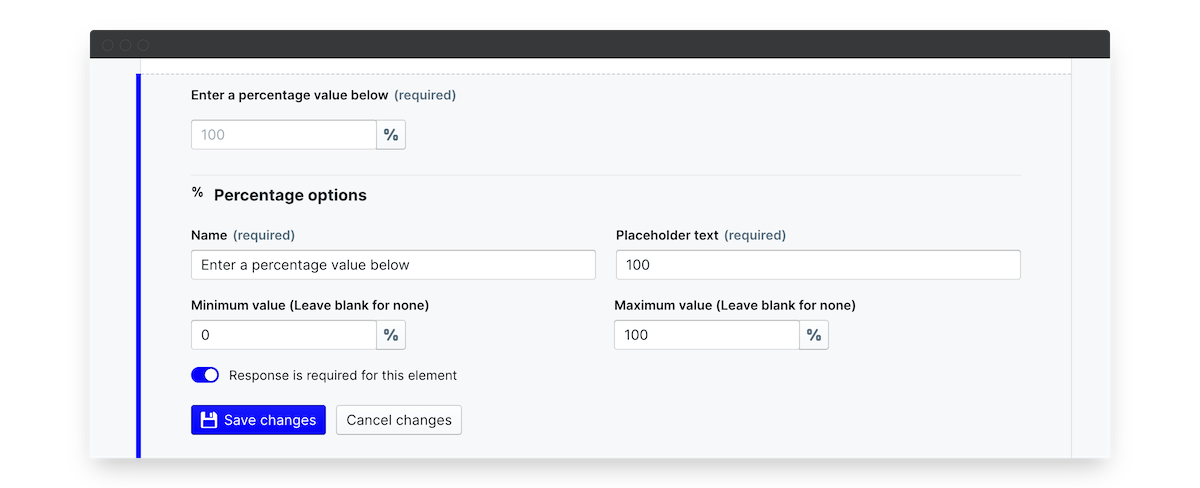
And, just like the Currency element, the Percentage element adds the % indicator to the end of the input percentage. On all of the numerical fields you can enter a placeholder number to give the participant an idea of what they should be entering - particularly useful in the Salary increase recommendation example.
Salary increase recommendation
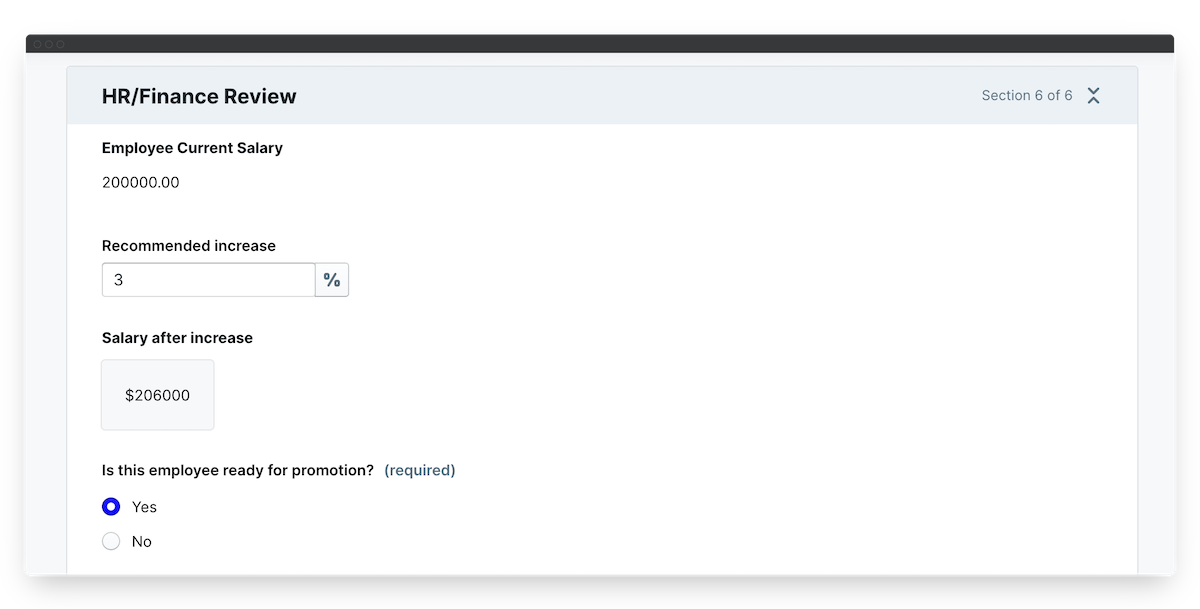
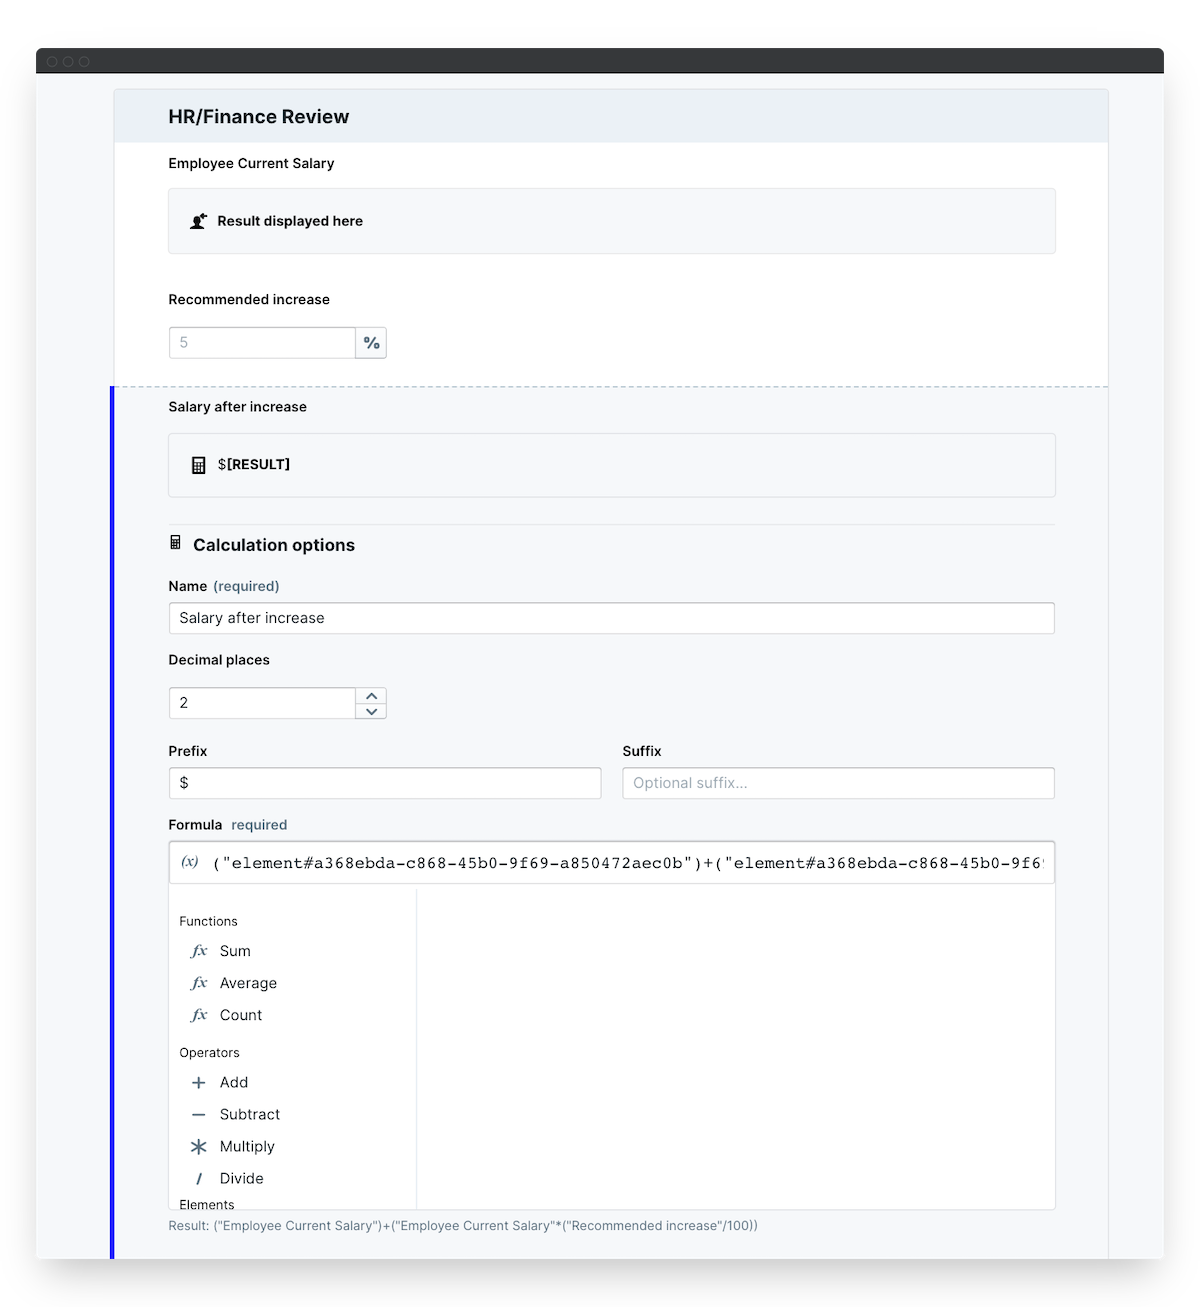
We've included an HR/Finance review in our Performance Reviews app. This app makes use of a few different element types! First we pull the employee's current salary using the Profile value element. Next we add our percentage element to ask the HR/Finance reviewer for their recommended percentage increase. This is a great example of using an anchor placeholder - we've set this at 5% as a benchmark. Once the participant puts in their recommended increase, a calculated element will show the final salary after the increasee is applied.
Weighted OKR contribution
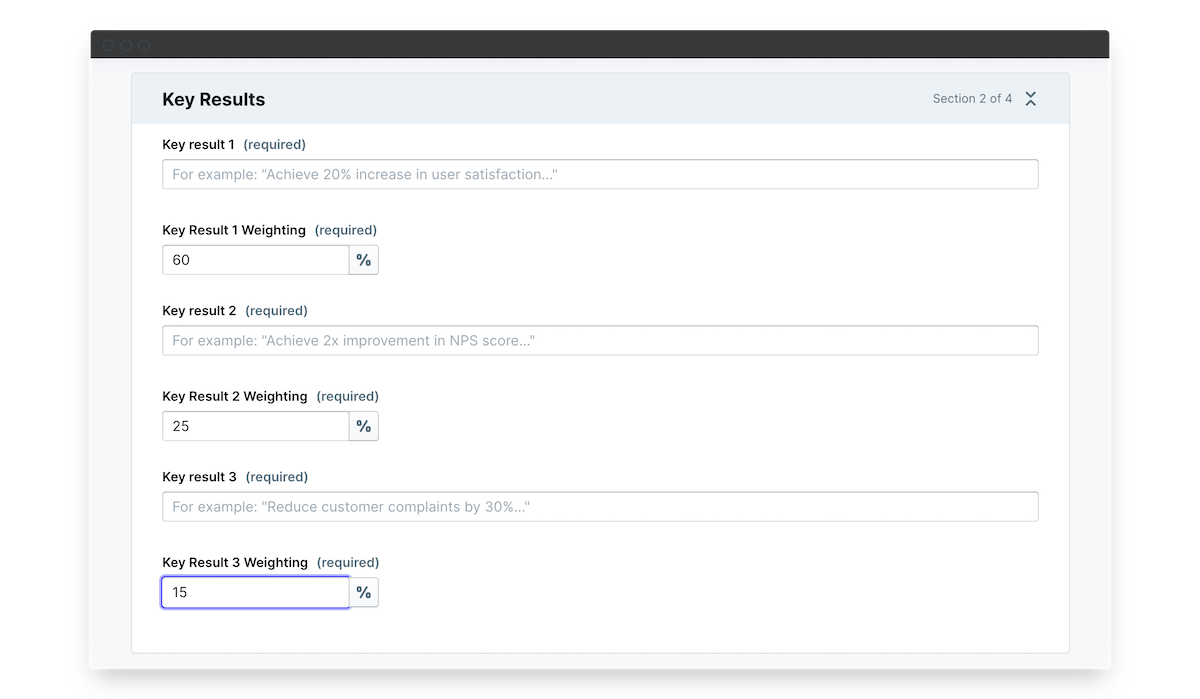
If you want to get really technical with your Key Results progress, you can add a percentage weighting to each key result. You can then apply the weighted percentages to your progress calculation, making sure that some key results count more than others.
Slider
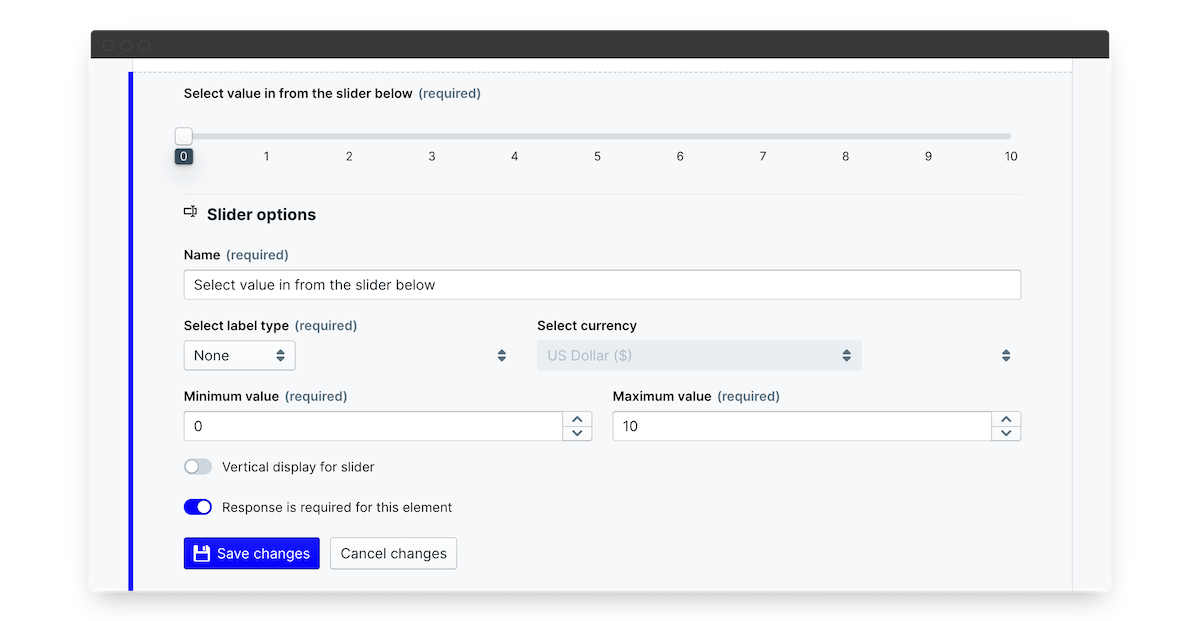
The Slider element lets users click and drag the slider along a pre-defined scale. This can be anything you like - we default to a 0 - 10 scale, but you can set your minimum and maximum values in the elemnet editor. Some people prefer to use the slider for performance ratings over the drop-down select.
In the Select label type field you can choose a percentage or currency label. When you're assessing progress the slider is a more intuitive element to use than the percentage input.
You can also choose to display your slider horizontally or vertically. A vertical slider works best when it's a smaller scale (0 - 5); and for anything larger we'd recommend using the horizontal display.
Goal progress
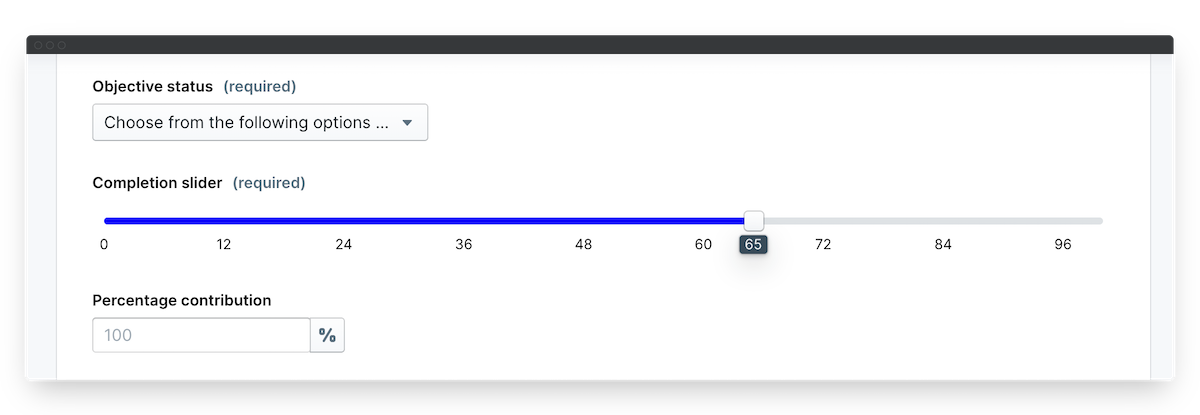
The most common use case for a slider is to indicate the overall progress of your goals and objectives. Set the slider to a 0 - 100 scale (or 120 if you want to capture how far people exceed their targets!) and employees will click and drag to indicate how far along they are in achieving their targets.
eNPS
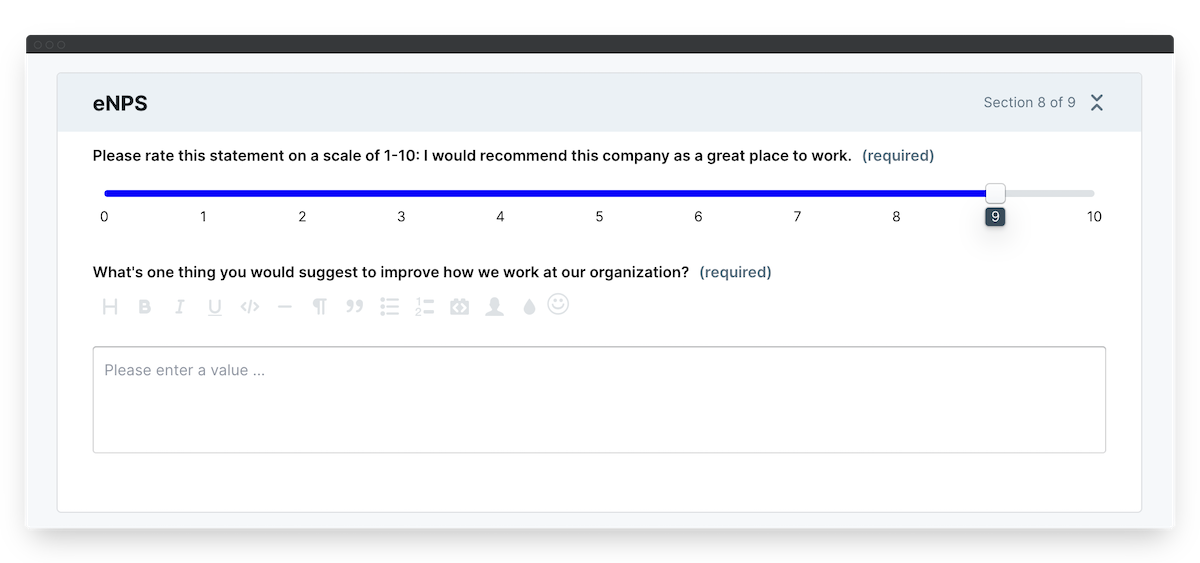
eNPS stands for Employee Net Promoter Score, and is taken from the NPS - a score typically used to assess how likely someone is to recommend your business or product to others. In the context of employee engagement this is a really easy to measure metric that asks employees on a scale of 0 - 10, how likely are they to recommend your company as a great place to work. You can use this score to benchmark your overall company satisfaction in your first engagement survey, and then track your progress as you run more surveys.
Range Slider
The Range Slider has all the same options as the Slider element, but gives you two indicator points along the slider bar.
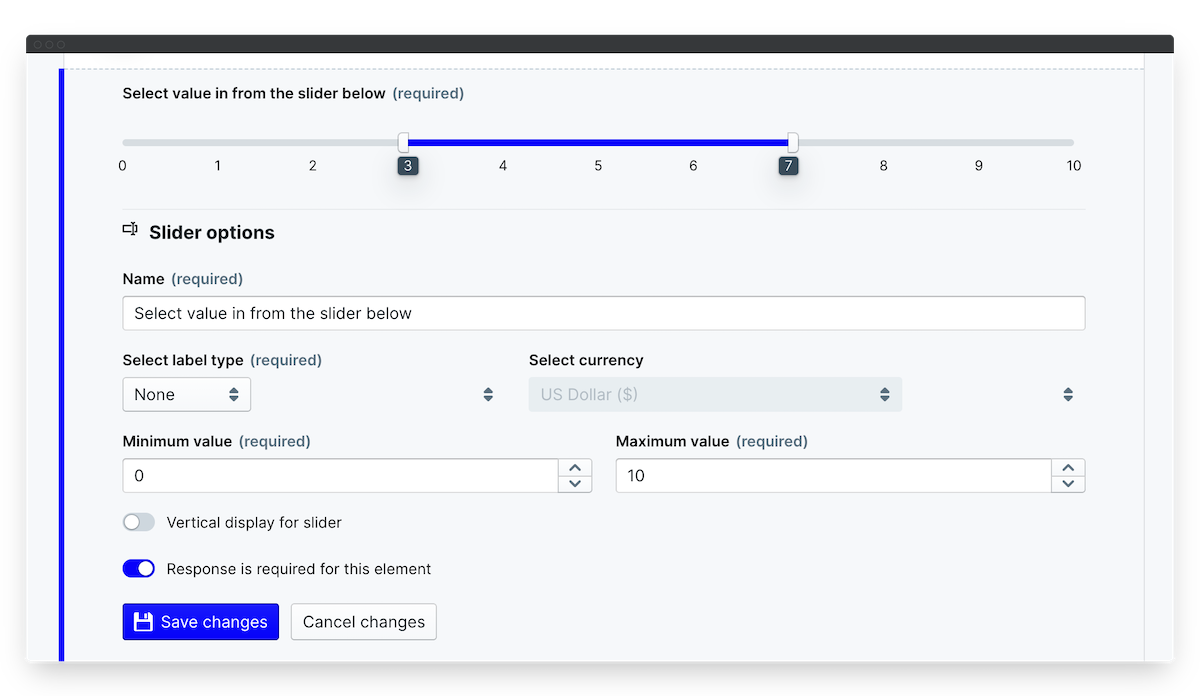
Users will input both a minumum and maximum value (instead of a single-point value in the slider element) to show a range in their response. Some areas where this is used include:
Baseline vs. Target indicator
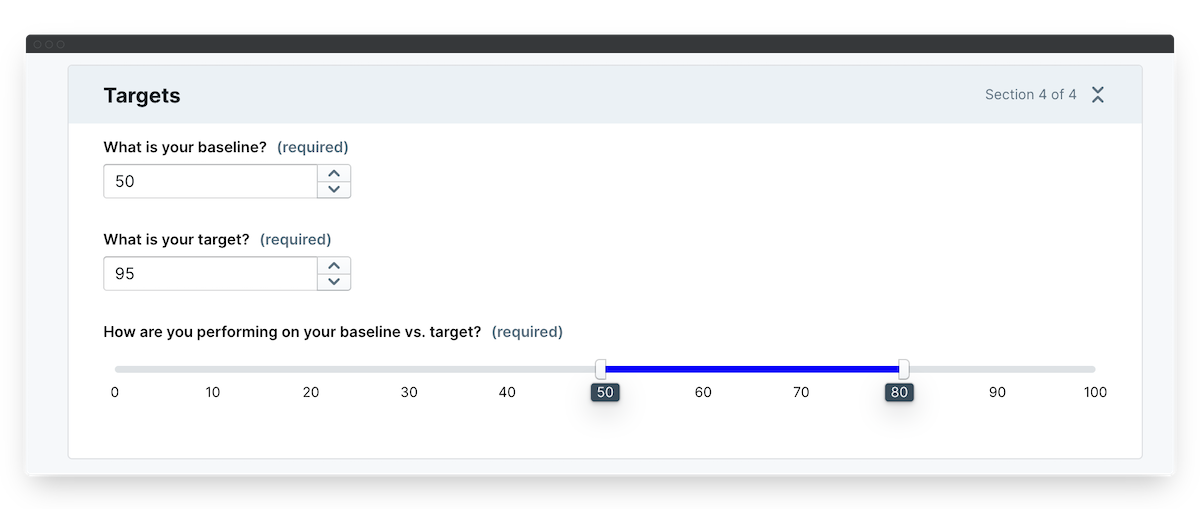
When setting up quantitative targets it's really useful to track your baseline (your starting point) vs. your target value. Using a range slider lets you easily visualize your current progress vs. the baseline, and how far you are from achieving your target.
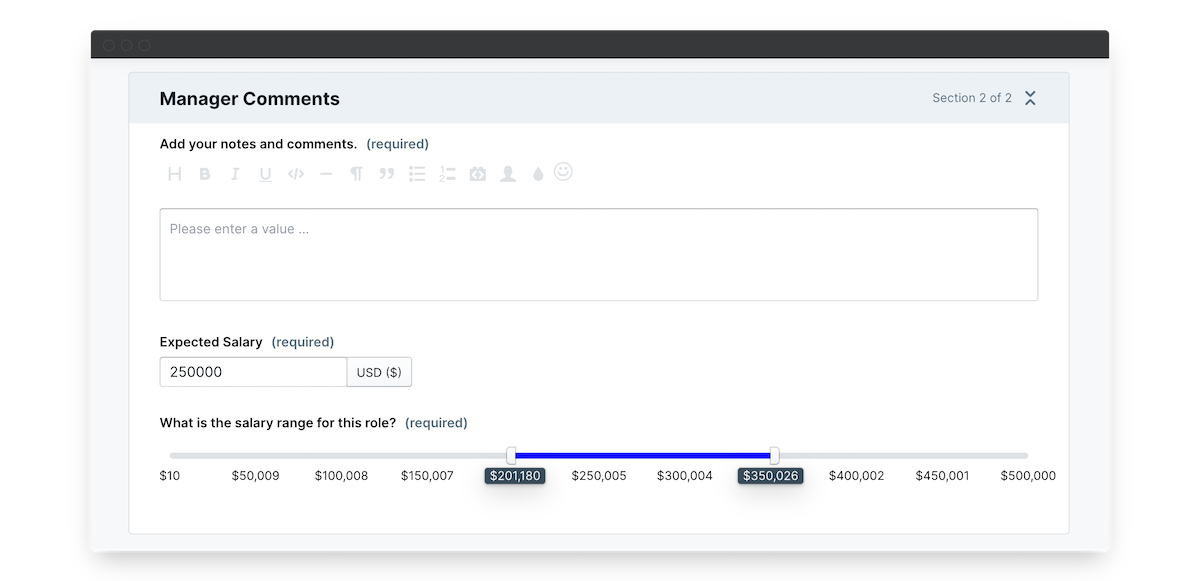
Salary range
In a new applicant tracker or a compensation assessment, use thee range slider to ask what salary range this particular role falls under. This data can then be used in your reporting, or simply to assess whether the applicant's expected salary is within the range for this department's budget.
Calculation
The Calculation element has a huge range of applications - from showing average performance review ratings to calculating what a final salary would be after an increase is applied, or tallying up how many responses have been given within a survey. The Calculator element can be used on any form element where a numerical value applies; so every element in the Numerical group as well as Selects and Grids.
To start building your calculation:
- Name your element (e.g. Total pay packet after bonus)
- Select how many decimal places to display in the calculation
- Add an optional prefix or suffix (e.g. a currency placeholder for $ values)
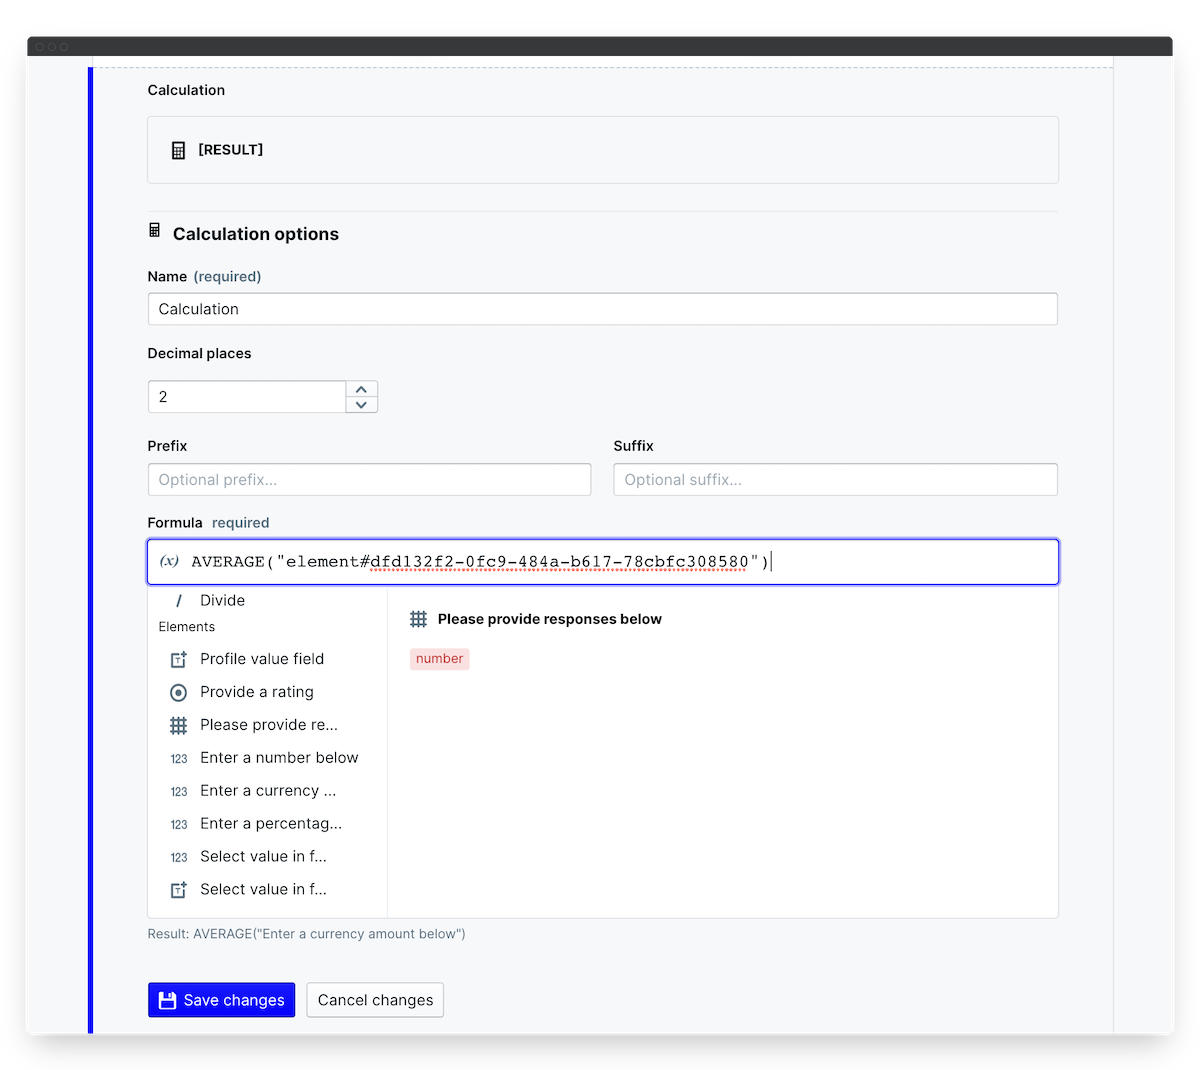
- In the formula bar, select from the Functions (sum; average; count) and Operators (add; subtract; multiply; divide) and then scroll down to select which Elements to calculate.
- In the Formula bar your element IDs will display, with a preview in the field below. Remember to encase all elements in brackets.
- Underneath the Formula area, your output Result will display in grey, or you'll see red error indicators to update your formula until it's correct.
Compensation and bonus calculation
Going back to our Percentage example, the calculated element is used to show what the employee's next salary will be after their increase. The structure of the calculation is simple and uses just the two elements above. You can see your output below the Formula field to check if the formula structure is correct.
Average performance review ratings
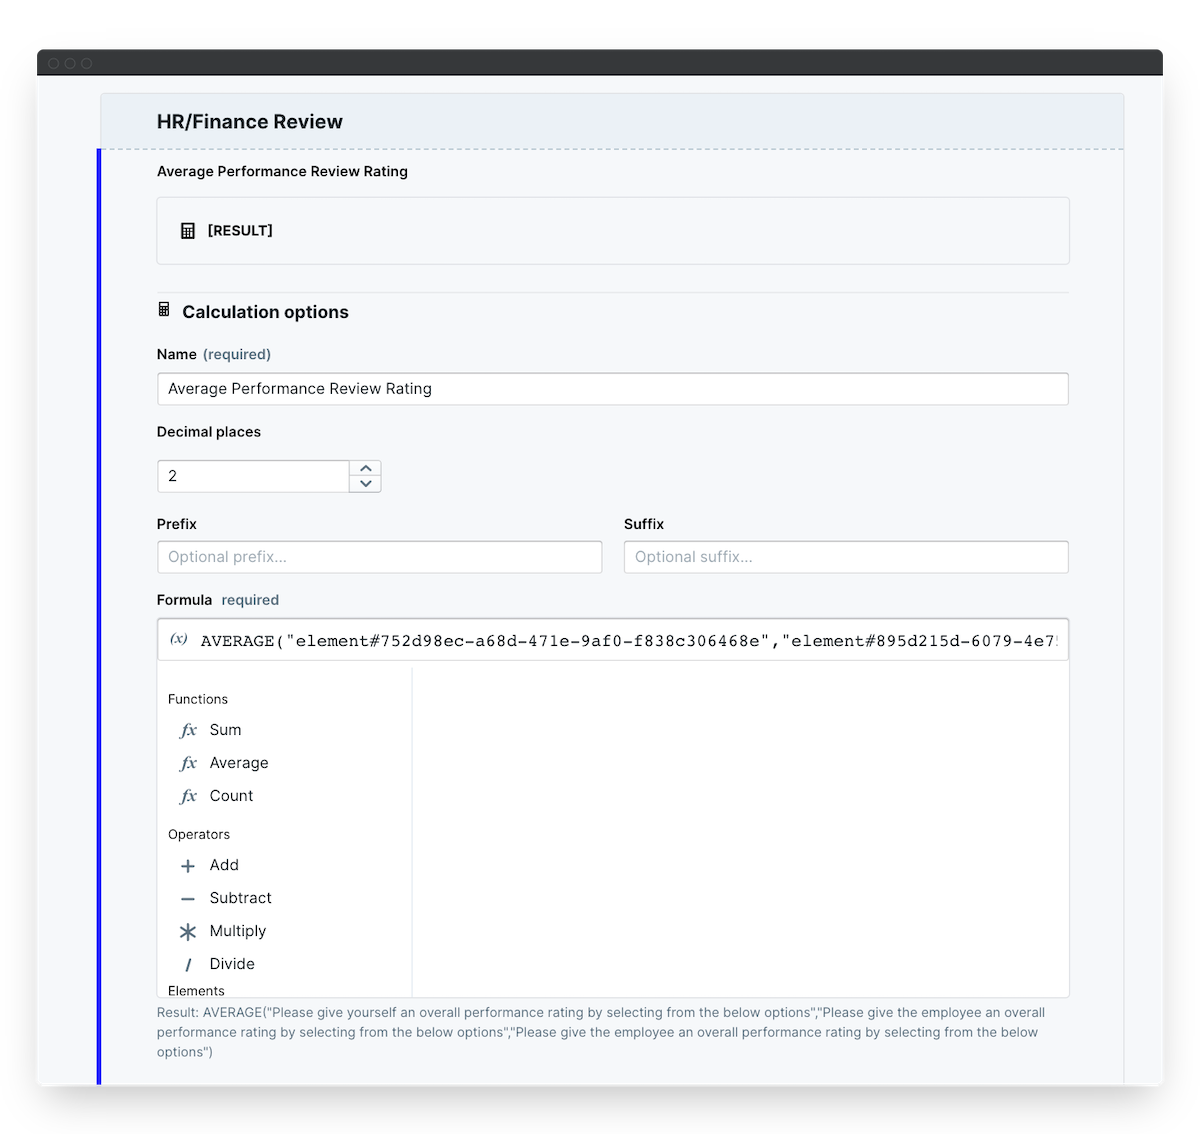
As an overall indication of a review score, we've taken an average of the employee, their line manager and their senior manager's review scores. You can also calculate an average of responses to individual review questions to show an overall average, and then create an additional option > select element for the reviewer to select a final score in line with your review ratings.
Note that when users start filling out their items, they will need to save their changes for an initial calculation to display, and save again to update the calculation after any additional changes to their responses.
Next, let's look at Calendar elements for setting dates and times in your app templates.
PeopleGoal Team
General content from our team

